
Not all traffic is created equal...
So why do we measure them like they are?
July 10, 2026
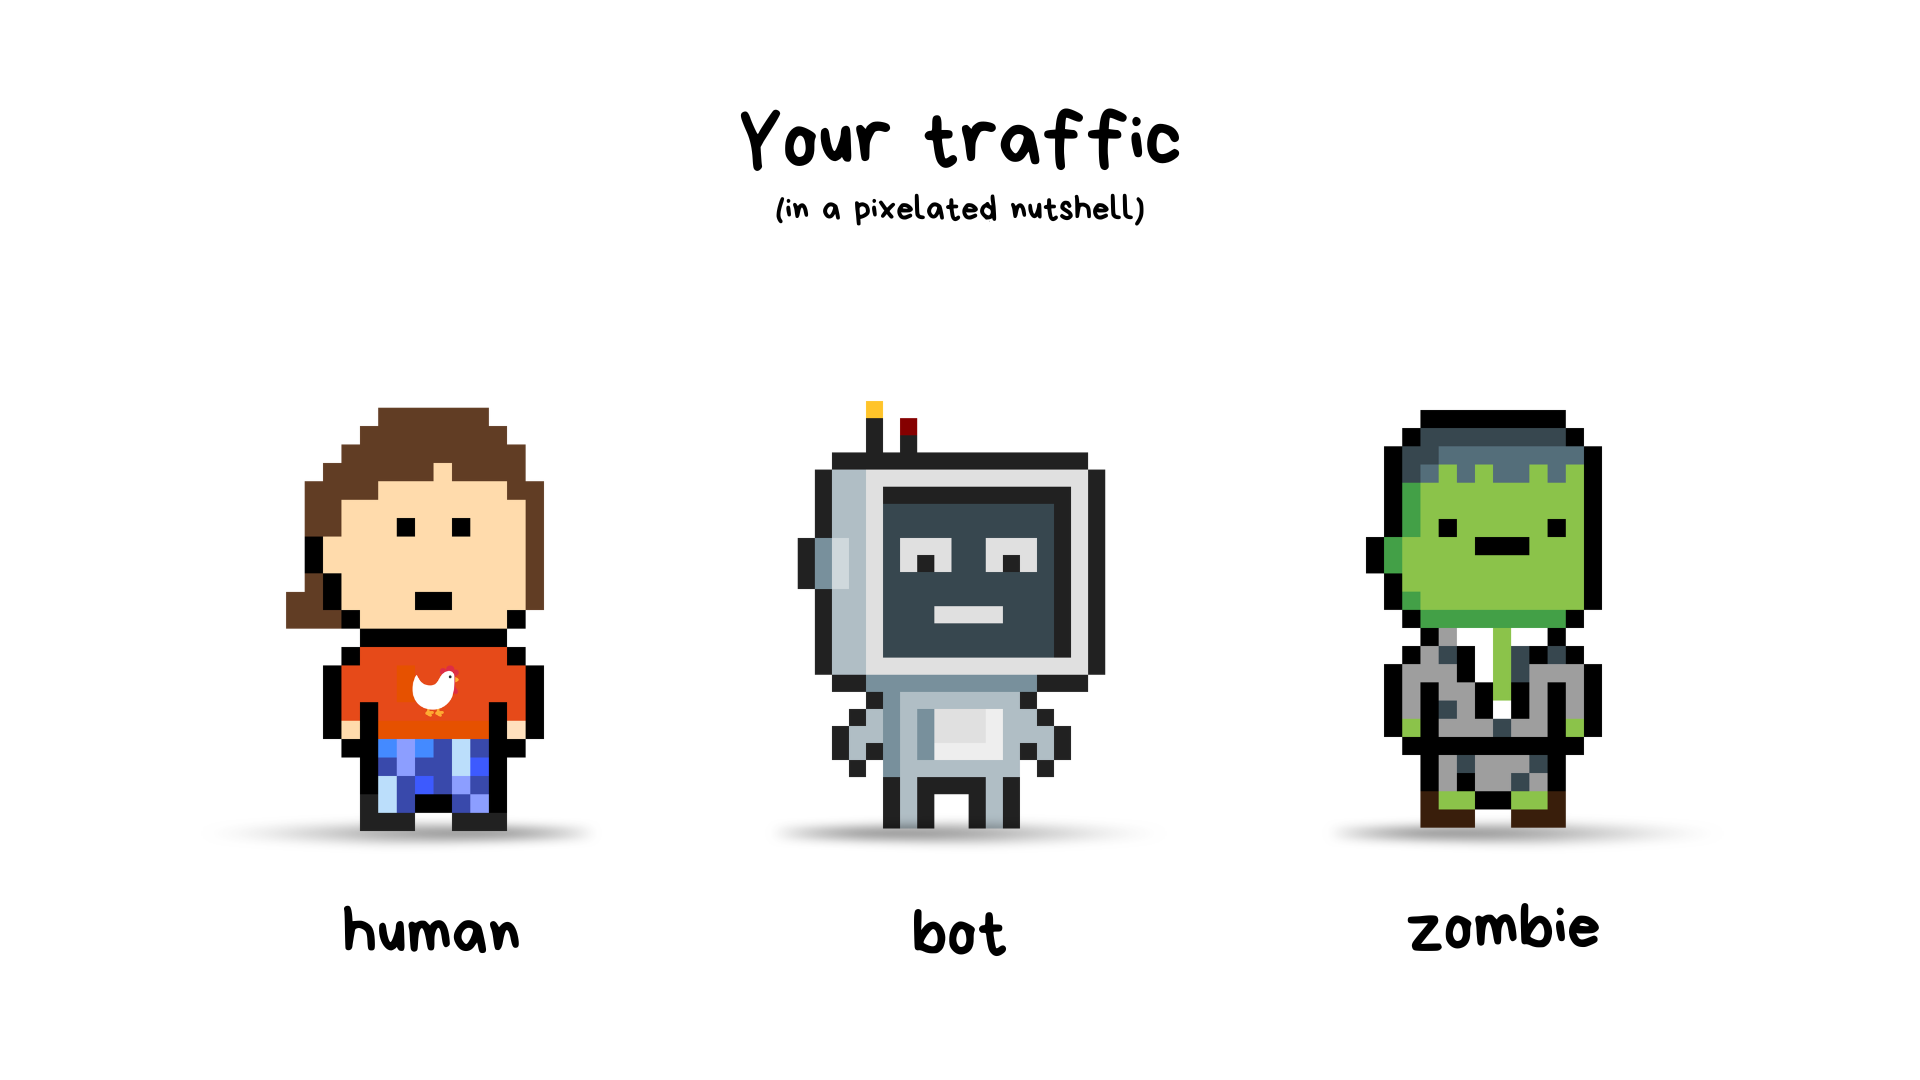
I especially had fun creating the pixel zombie on this one.
And I don’t know why, but this zombie is wearing a haggard gray suit. It’s probably because movies depict zombies wearing nice clothes all torn up. Like they just left the office and going home to eat dinner and/or your face. I don’t know why they are never wearing a band shirt or that shirt with Che Guevara on it. It would be cool if one was wearing a “Kiss me I gave blood” shirts you used to get at a blood drive.
Anyway....
Zombies are a interesting class on traffic in my books. I define them as visitors who come to your site, never interact or engage or click anything, and then leave. They are not a customer nor were they ever planning to be... or maybe they could be a customer but that session was a fluke because they clicked on your ad, and in a fit of absolutely excitement over finding your store, spilled their coffee on their lap, causing them the throw their arms up, sending their phone flying out the window of their car, going straight through a metal grate into the gutter.

In those scenarios, they will come back later. Maybe. We cannot control the wind or human spasms. Regardless, it does not matter. No reason to count that in your analytics.
Conversion Rate typically is counted by Orders and Session. This is oversimplified on purpose. When you are a platform (like shopify), you cannot afford to have a confusing analytics dashboard. That would be bad for their biz. So lame, standard metrics that work for all stores are what we get.
Anyway, here is the basic formula -- CVR = (Total Orders / Total Sessions) x 100
Easy peasy...
Ecommerce stores on average hover around 3% CVR with this. And it works. Kinda. For the most part. And good for reports. And covering your ass... aka reporting. So now I’m being redundant…
On the store I currently manage, when you strip out the bots and zombie traffic, our hero product is over 15%. And our 2nd most popular product is around 12% last I checked. Some products are super duper low.
And that brings us to the point..
If we discount non-customer traffic, we can actually see which pages are performing well and which need work. We can study what the real customers are clicking on, where they go after the product page, or which products they click on a collection.
Remove the noise and watch what the humans are doing on your website. That is how you get a sense of what your conversion rate optimization plan will look like. Less noise. Easier to identify roadblocks and missed opportunities. Easier to spell our actual opportunities. And less time jumping around trying to fix everything because your analytics says you are 2.2% today instead of 2.5%.
Analytics that tell you where to focus your attention are way more useful that analytics that just tell you what to report.
Analytics for the sake of analytics is for data scientists... analytics for ecommerce operators needs to be directional and informing your next moves.
If you want these types of analytics, get Mouse Whisperer: CRO Analytics & AB Testing for Shopify Stores. It’s free (for now). Link to Shopify App Store
If you want me to pixelate you as one of The Real Heroes of Ecommerce, reply with a photo and your superhero name.
Originally sent as an email — view on Substack.
Get the next one by email
New issues go out as they are written. No schedule, no filler.