Mouse Whisperer

The CRO app built for people whose job title doesn't include CRO...

Your analytics count every visitor, bots included. Mouse Whisperer counts the real humans, shows you exactly what they did on each page, and helps you fix what's costing you sales.

Data Analytics

Mouse Whisperer is a script that watches how people behave on your pages… not just how many showed up. And it filters out the traffic that isn't a real person.

What is behavioral data?

Your store analytics tell you what happened: 500 sessions, 12 orders, 2.4% conversion. They don't tell you why.

Behavioral data is the "why" layer. For every page view, Mouse Whisperer records what the visitor actually did:

• How far down they scrolled — did they ever see the reviews? The size chart? The add-to-cart button?

• How long they stayed, and whether they were actually reading or just parked on a tab

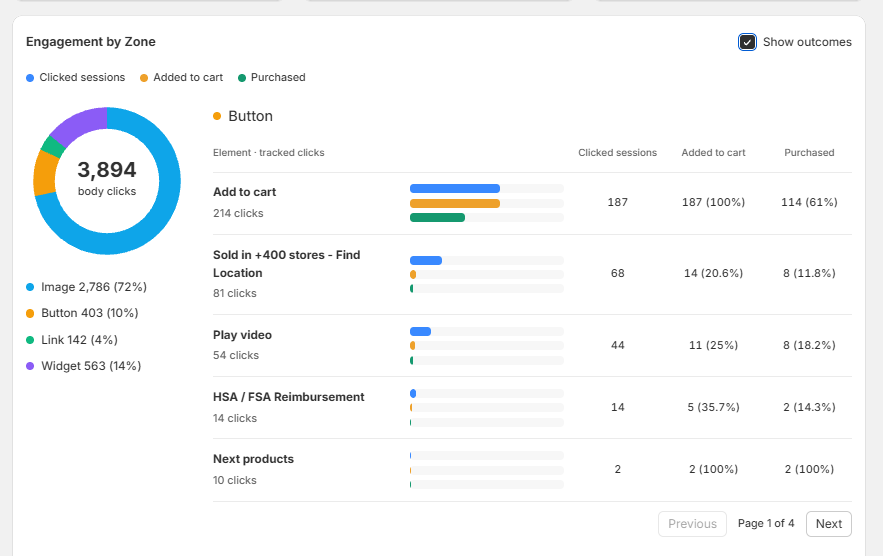
• What they clicked — and which button, by name ("Add to Cart" vs "Buy Now" vs "Size Guide")

• How they left — closed the tab, hit back, clicked through to another page, went idle, or went to checkout

• What they searched for on your site, and which filters and sort options they used

• Whether they moved a mouse, tapped, or typed at all — the difference between a person and a script

Put together, that's the difference between "this product page gets 800 visits and 6 sales" and "this product page gets 800 visits, 71% of people never scroll past the hero image, and the ones who do add to cart at 4x the rate."

One of those you can act on.

Is this data missing from my store?

Almost certainly, yes.

Shopify Analytics is built to report on orders. It's excellent at that. What it can't tell you is what happened on the page before the order didn't happen.

Here's what your existing reports don't have:

You have sessions per page. You don't have what those sessions did on the page.

You have a store-wide conversion rate. You don't have the conversion rate for one specific product page.

You have traffic sources. You don't have which traffic source sends people who actually engage.

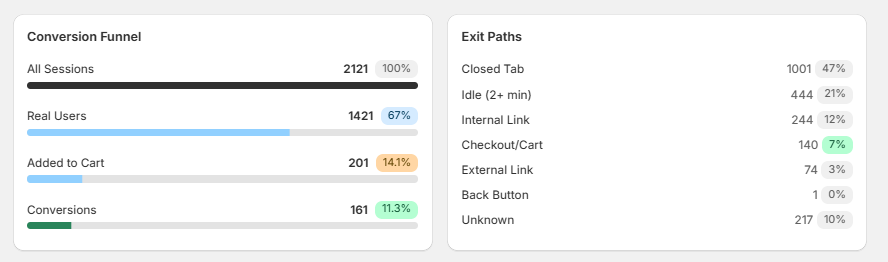
You have total sessions. You don't have total sessions with the bots removed.

That last one matters more than people expect. Bot traffic doesn't just inflate your session count — it deflates every rate you calculate from it. If a fifth of your traffic is automated, your conversion rate looks 20% worse than it is, and it looks worse on some pages than others. You end up "fixing" a page that was never broken.

Other data MW collects:

Beyond the behavior itself, every visit is tagged with context so you can slice it:

Who they are (as a traffic category, not a person)

• Traffic source, medium, and campaign — Google organic, Meta paid, email, direct, referral

• Country, region, city, and timezone (derived from IP)

• Device type — desktop, mobile, tablet

What they did commercially

• Added to cart, and when

• Converted, and when

• Order value and currency

How real they are

Every visit gets classified into one of three buckets:

• Real — a human who engaged with the page

• Zombie — technically a human, but no meaningful interaction. Landed, did nothing, left.

• Bot — automated. Scrapers, uptime monitors, headless browsers, AI crawlers.

Every metric in the app is calculated from Real visitors only. Zombies and bots are still visible if you want to look at them, but they never pollute your rates.

--
What we deliberately don't collect: names, emails, addresses, payment details, or anything that identifies an individual shopper. Sessions are anonymous and identified by a random ID stored in a first-party cookie for 7 days.

A/B Testing

An A/B test is the only way to know whether a change actually helped.

You have a hunch: this product page would do better with the reviews above the fold. So you change it. Sales go up 8% that week. Did the change work? No idea — you also got a newsletter send, a cold snap, and a TikTok that did numbers.

An A/B test removes the guesswork. Half your visitors see the current page. Half see your new version. Same week, same weather, same TikTok. Whatever difference is left is your change.

Mouse Whisperer runs these on your real theme templates, so you're testing the actual page — not a mockup, not an overlay, not a script that rewrites the page after it loads.

Features

The whole app is four things: a tracker that doesn't slow your store down, snapshots that tell you which pages are weak, audits that tell you why, and A/B tests that prove your fix worked.

Uninterruptive Tracking Script

Every app you install is a tax on your store speed. This one is about as close to free as it gets:

• Loads last. The script is deferred — it waits until your page has finished rendering before it does anything. Your store loads at exactly the speed it did before.

• No theme edits. It installs as a theme app embed, which means a toggle in your theme editor. Nothing is written into your theme files. Uninstall is a toggle too.

• Sends data on the way out. Instead of chattering to a server while your customer is shopping, it batches everything and sends one small payload as the visitor leaves the page, using the browser's built-in background-send. It can't block anything, because there's nothing left to block.

• No pop-ups, no overlays, no widgets. Your customer never sees or feels it. It changes nothing about your store's appearance or behavior.

Store snapshots vs page snapshots?

Two different tools for two different questions.

A Store Snapshot answers: "where should I even start?"

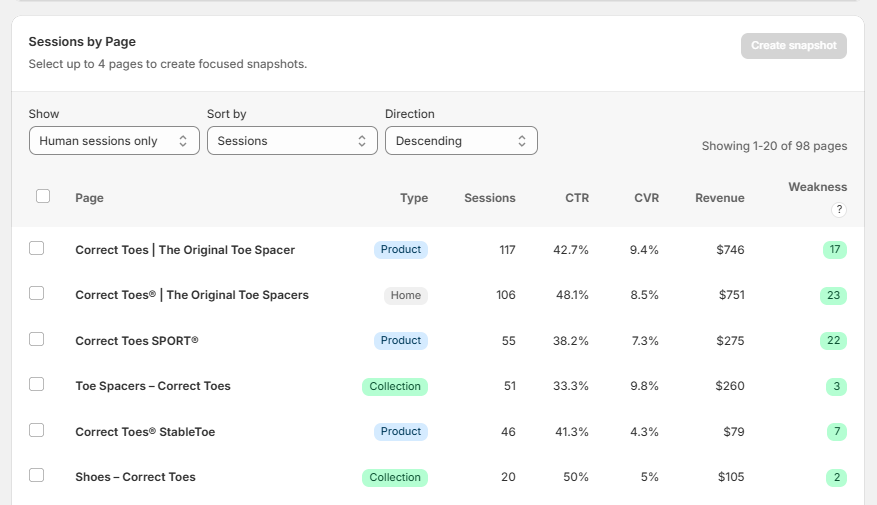
It watches your whole store for a set period, groups every visit by page, and scores each one. You get a ranked list: these are your weakest pages, and here's roughly what they're worth fixing. It's the "point me at the problem" tool. You run this first, and you run it rarely.

A Page Snapshot answers: "what exactly is wrong with this page?"

You pick one page — a specific product, a specific collection — and go deep. Scroll depth, every CTA click by name, exit behavior, search terms, filter usage, add-to-cart rate, conversion rate, revenue. It's the "diagnose it" tool. You run these constantly.

Product page audits

Point it at a product page and you get the full behavioral picture:

• Add-to-cart rate and conversion rate for that specific product page — not your store average, and not blurred by bot traffic

• Revenue attributed to that page, plus total revenue from sessions that touched it

• Scroll depth — what percentage of visitors reached 50%, and 100%. If nobody reaches your reviews, your reviews aren't doing anything.

• CTA clicks by name — how many people clicked "Add to Cart" vs "Buy Now" vs "Size Guide" vs "Shipping Info." Real button names, real counts.

• Exit rate and exit type — did they leave your store entirely, or click deeper in?

• Bounce rate — arrived, did nothing, left

• On-site searches performed from that page — a search on a product page usually means "this page didn't answer my question"

Run the audit again after you make changes and compare.

Collection page audits

Collection pages fail differently from product pages, so they're measured differently.

A collection page has one job: get people to a product. So the headline metric is click-through rate — what percentage of visitors actually clicked into a product.

You also get:

• Filter and sort behavior — which filters people apply, how many times they change them. Heavy filter-fiddling usually means your default sort is wrong or your collection is too big.

• On-site searches from the collection page — people searching from a collection means they couldn't find it by browsing

• Scroll depth — how far into the grid people go. If nobody scrolls past row two, products in row six may as well not exist.

• Exit rate — leaving from a collection page is the expensive kind of exit. They wanted something in this category and you didn't show it to them.

• Add-to-cart and conversion for sessions that started here

Channel Conversion Rates

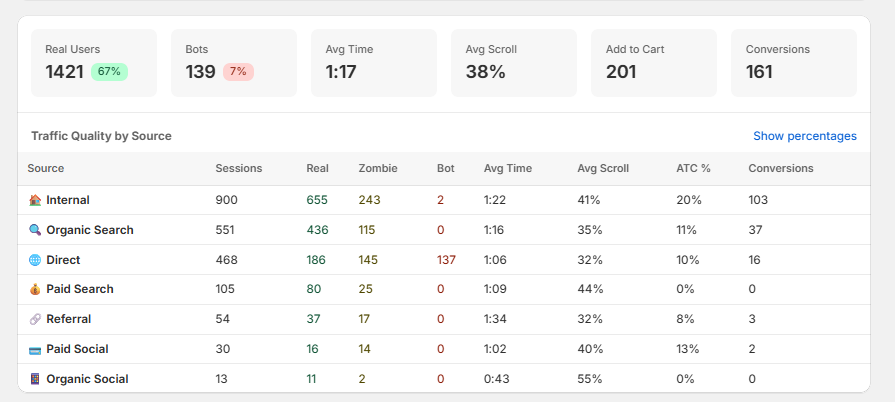
Every visit is tagged with where it came from — Google organic, paid search, paid social, email, direct, referral — so you can see conversion rate per channel, calculated from real humans only.

This is where bot filtering earns its keep. Bot traffic is not evenly distributed across your channels. It clusters in organic and direct, and it barely touches paid. So when you compare channels using raw session counts, you're systematically understating your organic performance and overstating paid.

Filter to real humans and the ranking can genuinely flip.

Product Conversion Rate

Shopify gives you a store-wide conversion rate. It's a single number averaged across every page, every product, and every visitor including the fake ones.

Mouse Whisperer gives you conversion rate per product page, from real visitors, alongside the behavior that explains it.

That's the difference between "our conversion rate is 2.3%" and "these four products convert at 5% and these nine convert at 0.4%, and the nine all have the same problem."

The second one is a to-do list.

Is there anything special about the AB testing?

Yes — three things, and they're the reason this doesn't feel like other A/B testing apps.

It tests your real theme templates.

Most A/B testing apps work by letting the original page load, then rewriting it in the browser. That's why you sometimes see a page flash and change on sites running tests — it's called flicker, and it's both ugly and bad for results, because some visitors see the old version for a moment and some never see the new one at all.

Mouse Whisperer duplicates your actual theme template into a real variant. Each visitor is assigned a variant on the server before the page renders, and then just gets that page. Nothing rewrites, nothing flashes. Both versions are real pages in your real theme.

Only real humans are counted.

The same filtering that runs everywhere else runs here. Bots and zombie sessions never enter the test results — which means your sample is smaller but honest, and you're not declaring winners based on scraper traffic.

It won't let you call a winner too early.

This is the most common way A/B tests go wrong. You're three days in, variant B is up 15%, you call it, you ship it, and it does nothing — because 15% on 60 visitors is noise.

The app holds back. Until there are enough real visitors in the test overall and enough in each individual variant, it will tell you "too early" instead of showing you a winner. Once there's enough data, it tells you which is leading and by how much — or tells you honestly that there's no clear difference, which is a real and useful result.

Test setup, briefly: pick a page type (product, collection, homepage, blog, page, or cart), pick what you're optimizing for (add to cart, conversion, revenue, click-through, or engagement), and launch. Visitors stay on the same variant for their whole session, so nobody sees the page change mid-visit.

App Workflow

CRO is a loop: find the weak page, work out why it's weak, change it, prove the change worked. Then do it again.

Prioritize CRO with a Store Snapshot

The problem this solves: you have 200 pages and no idea which one is costing you money.

Run a store snapshot. It watches your store, groups traffic by page, and scores every page on two things:

• Weakness — how badly is this page underperforming? Built from scroll depth, click-through rate, exit rate, and how much of its traffic was junk. Product pages are additionally judged on add-to-cart and conversion rate, because that's what a product page is for.

• Opportunity — how much traffic does it get? A terrible page nobody visits is not your problem. A mediocre page with a thousand visits a week is.

Rank by both and you get a genuine priority list. Not "here's everything wrong with your store," which is paralysing — a short list of where the money is.

Each page also gets a confidence rating based on how many visitors it's actually seen, so you know which findings are solid and which need more data before you act on them.

Audit top-priority pages with 1-click

The store snapshot doesn't just rank pages — it writes you a recommendation for each one, in plain language, with the reason attached.

Not "Page /products/blue-widget: score 71." More like: "1,240 human visits with 3% add-to-cart and 0.8% conversion. This product has enough traffic to diagnose product-page friction."

One click on that recommendation sets up a page snapshot on that exact page. You don't configure anything, you don't go find the page, you don't set up tracking. You click the problem and the diagnostic starts.

Then you get the X-ray: scroll depth, CTA clicks by name, exits, searches, filters — whatever that page type is judged on.

Dance the CRO dance...

Now the actual work, which is less mystical than the acronym suggests.

The audit tells you what's happening. You work out why, and you change something:

• Nobody scrolls past the hero → your product images are too tall, or your key info is too far down

• High exit rate, high search count → your page isn't answering an obvious question

• Good scroll depth, bad add-to-cart → they're interested and something is stopping them. Price, shipping, stock, trust.

• Lots of filter-fiddling on a collection → your default sort is wrong

• Good add-to-cart, bad conversion → the problem isn't this page, it's your cart or checkout

You don't need a CRO qualification for any of that. You need to see the behavior, which until now you couldn't.

Then you change one thing. Not five — one. Because in a moment you're going to test whether it worked, and five changes at once tells you nothing about which one mattered.

A/B test to see which changes impacted CVR & REV

You've made a change. Is it better? Genuinely — not "did this week look good."

Set up a template A/B test on the page you changed. Half your real visitors see the original, half see your new version, at the same time, under the same conditions. Pick what you're measuring: add to cart, conversion, revenue, click-through, or engagement.

Then leave it alone. The app will tell you when there's enough data, and not before.

You end up with one of three answers, all of which are useful:

• It won. Ship it. You now know what your customers respond to, which makes your next guess better.

• It lost. Revert it — and you just avoided permanently shipping something that would have quietly cost you money.

• No difference. That thing you argued about for two weeks doesn't matter. Go work on something that does.

Then go back to your store snapshot and take the next page off the list.

That's the loop. That's CRO. That's the whole thing.

Pricing Plans

Pricing not based on your traffic or your orders. You will not be punished for doing your jobs well.

Free | For users who are like ... well maybe but no, yes....

For finding out whether any of this is useful on your actual store, with your actual traffic.

• 1 Store Snapshot — find your weakest pages
• 3 Page Snapshots — diagnose three of them properly
• Up to 1,000 visitors per snapshot
• Full bot and zombie filtering — data quality isn't the paid part
• CSV and PDF exports

No card required.

That's a real run at the loop: find your worst page, X-ray it, and see whether what comes back is something you didn't already know. If it isn't, you've lost nothing but a toggle in your theme editor.

Whisper- $49.99 | For users who need to stop 2nd guessing themselves

For when you've stopped exploring and started working the loop.

• 5 Store Snapshots
• 50 Page Snapshots
• 5 A/B tests
• Up to 5,000 visitors per snapshot
• Everything in Free

The step up isn't just volume — it's the A/B tests. This is the plan where you stop guessing whether your changes helped and start knowing.

50 page snapshots is roughly a page a week for a year, or a concentrated month of fixing everything your store snapshot flagged. 5,000 visitors per snapshot is a large enough sample to trust the numbers on all but your quietest pages.

Signal - $99.99 | For users clinically addicted to CRO experiments

For people running tests continuously, on more than one thing at a time.

• 20 Store Snapshots
• 250 Page Snapshots
• 25 A/B tests
• Up to 25,000 visitors per snapshot
• Everything in Whisper

Twice the price, five times the everything.

25,000 visitors per snapshot means you can get a confident read on high-traffic pages and small differences — the 3% improvements that are invisible in a smaller sample but real money at your volume. And 20 store snapshots means you can re-scan monthly and watch your whole store improve, rather than checking in twice a year.

Let's go... that site isn't going to optimize itself.